I have been trying to write this post for several weeks.
It was not for lack of time or initiative, but because I became a slave to my own words by repeatedly promising that this article would be ready “this week, no excuses”. The real challenge (and I wish all problems were this fascinating) is the dizzying pace at which the field of artificial intelligence evolves.
Disconnecting from LinkedIn, skipping a newsletter or stepping away from a YouTube channel, even for a few days, inevitably means missing significant advances. Since I signed up to the list of contributors at Datola to write this article, countless AI developments have appeared that directly affect the data and digital analytics ecosystem. The landscape changes so fast that any article risks being outdated before it is published. But we will move forward with what we have, which is not little.
Also, you will have no excuse not to experiment with the tools I mention: most offer fully free plans or plans with reasonable limits. So, as people say these days, you can explore the potential of many tools “by the face”.
Without further ado, let’s look at how artificial intelligence is revolutionising our agile analysis method, the kind we analysts run when we need insights as fast as possible but still want an orderly, efficient and truthful approach. To illustrate it, we will use a fictional case (perhaps a bit exaggerated) that will give context to each step of the process:
We are asked to analyse several datasets from the Google Merchandise Store to reach relevant conclusions that can drive strategic decisions.
DISCLAIMER: The tools selected below and the analysis case are purely illustrative. Any tool must be used responsibly, and the user bears the consequences of any improper use.
1. Exploring the Analysis Topic or Industry
Whether we start from zero or already know the subject, it is always valuable to have contextual information that can affect the results of the analysis. The business world is so vast and diverse that trends or phenomena in some markets may be absent in others. Even within a single country like Spain, you can see notable differences in consumer behaviour and preferences depending on the region.
For the Google Merchandise Store, most analysts have a general idea of its purpose, but how well do we understand how it works inside, its position in the market or its sales strategies? Let’s deepen our knowledge of the origin, evolution and reach of this store using several AI tools:
Tools for Preliminary Research
Gemini with Deep Research Model
Ideal when we are not in a hurry and start from zero on the topic. This model is designed specifically for exhaustive research, offering detailed analysis that includes historical context, current trends and future projections.
Best way to use it: Ask open but specific questions such as “What is the complete history of the Google Merchandise Store and what role does it play in Google’s marketing strategy?” or “How has the Google Merchandise Store’s business model evolved since its creation?”.
Specific advantages: Depth of analysis, ability to synthesise information from multiple sources, and insights that are not obvious at first sight.
Example output: Link to detailed results
For the Google Merchandise Store, Gemini would reveal not only its role as the official store for Google-branded products, but also its role as a testing lab for Google’s analytics tools, where they experiment with Google Analytics, Tag Manager and other solutions before releasing them to the general public.
Perplexity Free Plan
Perfect when we have less time but a well-defined query. With the free plan we are limited to three searches a day, so we have to make the most of them. In my case I only alternate between two response models, the ones that have worked best for me: Deep Research mode for more detail and R1 DeepSeek mode (without bias) for information closer to the prompt.
Best way to use it: Ask somewhat more precise, multi-part questions such as “What are the main performance metrics of the Google Merchandise Store, its position in the corporate merchandising market and which analytics technologies does it use to monitor its performance?”.
Specific advantages: Concise but complete answers, ability to bring in current data from the internet, and citations of verifiable sources.
Example output: Link to Perplexity results
In our case, Perplexity could give us up-to-date information on the best-selling product categories in the Google Merchandise Store, the seasons of highest demand, and how its marketing strategy lines up with the launch of new Google tech products.
Ithy.com
The quickest option when time is short and we need research that is fast but informative enough.
Best way to use it: Ask direct queries, the same way as with Perplexity. Specific advantages: Response speed, structured format, and a focus on actionable data.
Example output: Link to Ithy results
With this tool we quickly get key information about the organisational structure of the Google Merchandise Store and how it fits into the Google ecosystem. With these three complementary outputs, we will have built a holistic view of the context before diving into the specific data. This preparatory phase is essential to formulate relevant hypotheses and recognise meaningful patterns in the later stages.
2. Let’s Start Playing with the Data
How we approach the data depends on how we access it: through visualisation tools such as Looker Studio, Tableau or Power BI, or through a direct export in tabular format for custom processing. You can also attach screenshots, but here we take on more risk of error, because the low resolution of screenshots can make the AI misread them, and it usually won’t warn you that it is about to make a mistake that can cost you if you don’t notice! For the raw data we will use this simple dataset. And for the other option, this PDF of a Google Merchandise Store Looker report.
Analysing Raw Data with AI
If we face unprocessed data and want to explore alternatives to the traditional (but no less useful) Excel, Claude offers fairly competent capabilities to generate intuitive and good-looking visualisations. Best way to use it: Upload the data as CSV, JSON or raw text and ask, for example: “Generate interactive visualisations that show an overview of the data”.
Important considerations: It is crucial to check carefully that the AI has interpreted the data correctly. If we spot inconsistencies or “hallucinations” (wrong interpretations of the data), it is better to start a new conversation with a clean context.
Implementation example: Link to Claude visualisations
In our Google Merchandise Store analysis, Claude could reveal interesting patterns such as the correlation between platforms and countries, the countries leading in conversion and sessions… Analysing Structured Reports
When we have dashboards in Looker Studio or Power BI with a PDF export option, we can boost our analysis with Notebook LM, a revolutionary tool that Google surprisingly under-promotes.
Best way to use it: Attach the report PDF along with the website URL to give the maximum context. Then we can ask: “Identify anomalies in the browsing behaviour of mobile users compared with desktop and suggest possible causes”.
Specific advantages: The ability to generate concept maps (mind maps) that visually connect different metrics and dimensions, making it easier to spot non-obvious relationships.
Implementation example: Link to analysis in Notebook LM (get in touch if you want access to the notebook and I will grant it)
Although Notebook LM can also process raw data, its real potential shows in generating concept maps and in its ability to connect multiple sources of information.
The recent addition of the mind-mapping feature is a significant step forward for analysts who need to visualise complex relationships between different datasets. Its processing capacity is also very large: you can load PDFs and very heavy files.
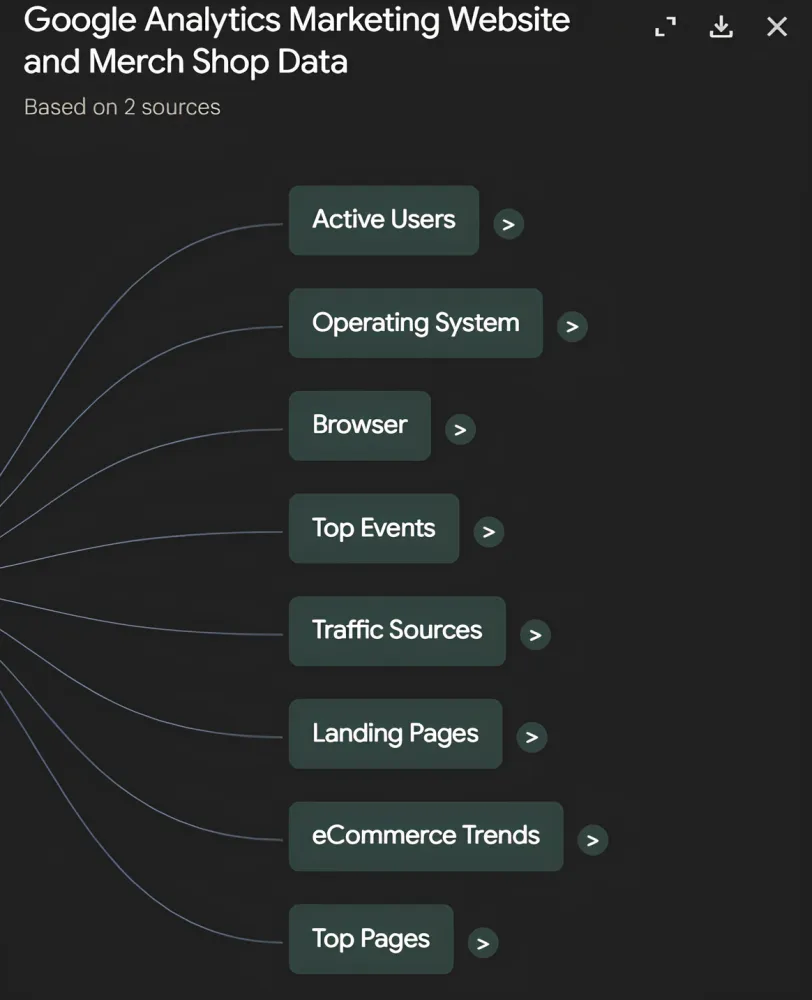
Example of a diagram in Notebook LM
For our Google Merchandise Store case, Notebook LM could help us visualise the full customer journey from different entry points to the final conversion, highlighting bottlenecks and optimisation opportunities along the way.
3. Brainstorming with the AI: Finding Hidden Insights
Once we have processed and visualised the data, it is time to dig into its interpretation. Do the patterns we see make sense from a business perspective? Do we see unusual trends that deserve more investigation? Are these results “normal” compared with industry standards?
For this phase of collaborative ideation with AI, we have several powerful options:
Google AI Studio
This platform offers several ways of interacting with the AI, including voice conversation, sharing videos and even real-time screen sharing for dynamic analysis.
Best way to use it: Share the screen while we explore our dashboards, letting the AI watch our visualisations in real time while we comment out loud: “I’m noticing a drop in conversion rate during these periods… what factors could be influencing it, based on the patterns you see?”
Specific advantages: Completely free, multimodal interaction, and the ability to “think out loud” with the AI while we analyse data.
Practical considerations: To get the most from this tool, it helps to prepare a clear mental structure of what we want to analyse, while letting the conversation flow naturally when unexpected discoveries come up.
Chat GPT
It offers standard voice functionality even on free plans, allowing a natural conversation around the data we analysed.
Best way to use it: Upload the relevant data first and then start a voice conversation with questions like: “Based on the conversion trends we saw in the Christmas season, what pricing strategies would you recommend to improve next year?”
Specific advantages: Excellent integration between voice mode and data analysis, giving a fluid conversational experience that simulates a brainstorming session with a fellow analyst.
Microsoft Copilot
It provides a remarkably natural conversational experience, though with some variability in performance.
Best way to use it: It would work best for very general queries. Important considerations: Its inconsistent performance makes it a secondary option for free plans, although its interface is particularly friendly.
Notebook LM (Simulated Podcast Feature)
A curious feature that generates conversations between fictional characters based on the data analysed.
Practical considerations: Although at first it may seem more of a curiosity than a serious analytical tool, this feature can be surprisingly useful for getting divergent perspectives. The “characters” often represent different stakeholders (the marketing lead, the financial analyst, the product director) and their conversations can reveal or anticipate likely reactions when the data goes public.
Specific advantage with the Plus plan: It lets the user join the conversation, interacting directly with the simulated characters to dig into particular aspects of the analysis.
For our Google Merchandise Store analysis, we could use a combination of these tools: start with Google AI Studio for a collaborative visual exploration of the dashboards, add ChatGPT to dig into specific statistical patterns more quickly, and finish with Notebook LM to simulate a conversation around the data. And if you pay for Plus, you can defend yourself if they blame you for the mess.
What matters in this phase is giving the AI as much context as possible. The more contextual information it has (about the industry, the company, the specific goals of the analysis and the preliminary hypotheses), the more valuable and actionable the insights it generates.
4. Documenting the Analysis: Structuring the Findings
After the exploration and ideation phases, we will have gathered many conclusions, key data points and possible lines of action. It is time to organise all this information into two complementary formats:
Detailed Documentation
An exhaustive document that includes all relevant findings, the methodology applied, the data sources used, the limitations of the analysis, and well-grounded strategic recommendations. This format is aimed mainly at technical stakeholders or anyone who needs to understand the whole analytical process.
Elements to include:
- Context and goals of the analysis
- Methodology and tools used
- Detailed description of the datasets analysed
- Processing and transformations applied to the data
- Main findings and their statistical significance
- Limitations and methodological considerations
- Strategic recommendations with analytical justification
- Appendices with supplementary data
Implementation example: Link to detailed documentation
Analysis Summary
A condensed, highly structured version that highlights only the most relevant and actionable findings. This format is aimed at those who need quick access to the main conclusions.
Elements to include:
- Goal of the analysis in one sentence
- 3-5 key findings
- Direct implications for the business
- Priority recommendations
- Suggested next steps
Implementation example: Link to executive summary
For our Google Merchandise Store analysis, we can see that both options try to convey the same information, but having different versions lets us adapt the message to the situation.
It is essential that both documents stay consistent with each other, differing only in level of detail, never in the main conclusions or strategic recommendations.
5. Presenting the Analysis: Visualisation as Narrative
Here we reach the most creative part and, at the same time, the one that most determines the impact of our analysis. The ability to turn data into convincing visual narratives can be the difference between an analysis that leads to concrete action and one that gets filed away with no effect.
Data visualisation and analysis must work as complementary skills: the best insights have no impact if they are not communicated well, and the most attractive visualisations are useless if they do not convey relevant information.
Advanced Tools for Visualisation with AI
Napkin
A revolutionary tool for creating visual schemes and concept diagrams with a minimalist but highly effective approach.
Best way to use it: First define the paragraph we want to visualise, then pick the style that fits best. Specific advantages: Intuitive interface, minimalist and professional look, and the ability to generate conceptual visualisations that communicate complex relationships in an accessible way.
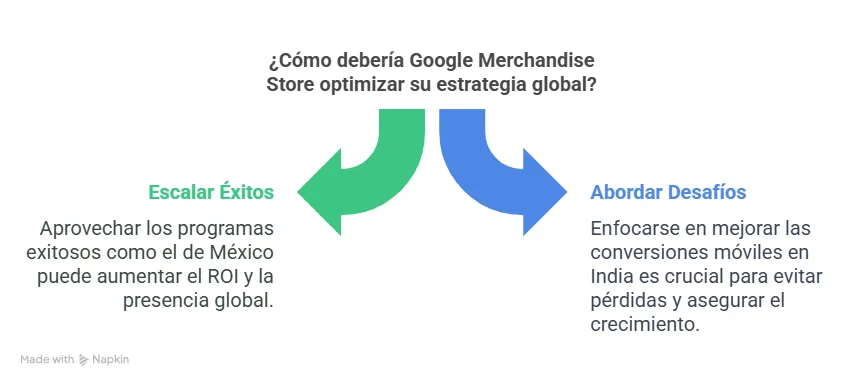
Example of a visualisation with Napkin
Implementation example: Link to Napkin visualisations
Gamma
A complete platform for creating dynamic, interactive presentations powered by AI.
Best way to use it: Paste either version of the analysis documentation. Then you need to choose the style, number of slides, length… Specific advantages: interactivity options, and the ability to generate logical transitions between concepts.
Advanced feature: You can add your company’s official corporate templates (available on the paid plan), so your presentations keep the organisation’s visual identity.
Implementation example: Link to presentation in Gamma
For our Google Merchandise Store analysis, we could use Napkin to create specific visualisations of the conversion funnel and navigation patterns, while Gamma would let us bring those elements into a narrative presentation that places the findings within the company’s strategic goals.
The real art in this phase is finding the balance between analytical precision and clarity of communication. The best presentations combine methodological rigour with an accessible narrative that connects the data to tangible stories and business goals.
6. Analytical Resilience: Handling Feedback (satire).
Even the most rigorous analyses and the most impactful presentations can meet organisational resistance or a lukewarm reception. It is an inherent part of the analytical process and it pays to develop ways of handling these situations constructively.
Sesame: The AI Companion for Hard Moments
Instead of letting frustration take over when our analysis does not get the recognition we expected, Sesame offers a unique conversational experience with a more human, even humorous, approach.
Best way to use it: Talk with this AI of distinctive personality to process emotions and recalibrate perspective: “I just presented an analysis that took me weeks and it barely got any attention… how can I refocus it to have more impact?”
Specific advantages: A unique conversational tone that combines empathy with humour, the ability to offer alternative perspectives, and a focus on practical solutions.
Special consideration: Although it can be overly chatty at times, that may be exactly what we need to decompress after a tense presentation or a harsh feedback session.
Example interaction: Audio of a conversation with Sesame
Beyond Sesame, and jokes aside, it is essential to develop analytical resilience practices:
- Document methodologies and decisions meticulously. This makes it easier to defend our work against criticism and to build long-term credibility.
- Ask for specific feedback instead of general opinions. Questions like “Which visualisation did you find most useful?” or “Which recommendation seemed most feasible to you?” produce more constructive feedback than “What did you think of the analysis?”.
- Iterate based on the feedback received. Agility does not end with the presentation; the real value comes from continuously refining our analyses based on stakeholders’ reactions.
- Keep a community of practice. Connecting with other analysts who can give technical feedback and professional support is invaluable for continuous growth.
Conclusion: The Future of Agile Analysis with AI
Bringing AI tools into our analytical workflows does not just increase operational efficiency, it fundamentally transforms our ability to extract meaningful insights and communicate them so that they carry some weight. This transformation brings both opportunities and responsibilities.
On one hand, the tools described in this article democratise advanced analytical capabilities, letting professionals with different levels of technical expertise produce sophisticated analyses. On the other hand, this greater accessibility demands more methodological rigour and critical thinking to avoid spreading wrong or superficial conclusions. The analyst of the future will not be replaced by AI, but empowered by it.
The most valued skills will shift from technical execution to asking incisive questions, interpreting results in context, and turning data into strategic recommendations. As you experiment with these tools in your own analytical projects, I encourage you to keep a healthy balance between technological enthusiasm and scepticism about what we do not really know how it works. The real magic is not in the tools themselves, but in how we fit them into rigorous analytical processes that create tangible value for our organisations. In other words: don’t force AI into our workflow. It can itself help us detect inefficiencies or bottlenecks and, from there, find a starting point. And remember: in a field evolving as fast as AI applied to data analysis, curiosity and constant experimentation are our best allies. The tools mentioned in this article are just a snapshot of one moment in this accelerated evolution. We will see in the coming years, or even months, how the landscape has changed since this post was published.
Which AI tools are you using in your analytical processes? What challenges have you found in bringing them into your workflows? Share your experiences in the comments!
Keep reading

How to measure brand visibility in AI answers
A case study from an insurance brokerage's marketing data stack. Share of voice among peers, counting names or cited domains, shows what a name-only count hides.

OmniZenit: the analytics debugger nobody asked me to build
A product case study of a Chrome extension I started on my own to check analytics events for one Inditex brand, and how it became the debugger used across the group.